User's Guide

ISOCLASS

Performs an unsupervised classification using an ISODATA algorithm

Function:

Performs an unsupervised classification using an isodata type clustering algorithm. Output consists of a single-band BYTE image of sample cluster assignments and a statistics file with means, covariance matrices, and the number of samples for the clusters. The input image data type may be BYTE, INTEGER*2, INTEGER*4 or REAL*4.

Parameters:

IN
Input image. The data type may be BYTE, INTEGER*2, INTEGER*4 or REAL*4.

OUT
Output image. The single-band output image of sample cluster assignments. Its data type is BYTE.

OUTSTAT
Output statistics file. It contains cluster means, covariance matrices, and the number of samples assigned to each cluster. The clusters are named CLUST01, CLUST02, CLUST03, etc.

STATSRC(NONE)
Source of statistics.

  = FILE:  Uses the cluster means found in the 
           statis tics file INSTAT as the initial 
           cluster centroids. 
  = NONE:  The parameter INSTAT is ignored and 
           ISOCLASS computes its own initial cluster
           centroids using the mean vector of the 
           input image as its starting point. 

INSTAT(--)
Input statistics file. It contains the initial cluster means. If FILE is specified for STATSRC, the mean values contained in INSTAT will be used as the initial cluster centroids for clustering. If NONE is specified for STATSRC, INSTAT will be ignored.

MAXNUMIT(2)
Maximum number of iterations. With each iteration, ISOCLASS passes through the input data and assigns samples to clusters using either a split or combine operation. Program execution will terminate once MAXNUMIT iterations have occurred, or the user may interrupt processing by using the VIEWIT parameter.

CLUSDIST(3.2)
Threshold for combining clusters. Any two clusters whose intercluster distance is less than CLUSDIST will be combined.

MAXCLSTD(4.5)
Threshold for splitting clusters. Any cluster whose standard deviation is greater than MAXCLSTD and whose number of points is greater than 2*(MINCLUST+1) will be split.

SSEPVAL(0.0)
Split separation value for clusters. If SSEPVAL is set to 0.0 (the default value), the cluster standard deviations are used in the split operation and in computation of intercluster distances. If SSEPVAL is not set to 0.0 (the default value), then when a cluster is split, the two new clusters will be separated by a distance of two times SSEPVAL. SSEPVAL will also be used in place of the cluster standard deviations in the intercluster distance computations.

PRINTIT(11)
Iteration frequency for printing summary cluster statistics. Cluster means, standard deviations, and cluster counts will be printed every PRINTITth iteration.

VIEWIT(21)
Number of iterations to process at a time. User is prompted every VIEWITth iteration to continue or interrupt processing. (See User Note 1.)

MINCLUST(30)
Minimum number of members allowed in a cluster. Any clusters with fewer than MINCLUST members will be deleted. MINCLUST is also used in determining whether a cluster may be split. See the parameter MAXCLSTD.

MAXCLUST(16)
Maximum number of clusters. When the maximum number of clusters has been created, splitting of clusters will no longer occur; although, the iterations will continue.

CHNTHR(3.2)
Threshold for cluster chaining. After the last iteration, all clusters that have intercluster distances less than CHNTHR are identified for possible chaining. Chaining is useful in situations where natural groupings of the data cannot be satisfactorily approximated by Gaussian distributions (individual clusters). The user will be notified which clusters may be chained, but the output cluster assignment image and the output statistics file will not be altered to reflect chained clusters.

PRINT("TERM")
Output destination. The destination of the output.

  = --:         No Report
  = TERM:       Terminal.  Output is sent to the 
                user's terminal.
  = LP:         Line printer.  Output is sent to the 
                printer defined by $PRINTER.
  = Filename:   User-supplied filename.  Output is 
                sent to the user-supplied file with 
                the extension ".prt".

Examples:

  1. LAS> isoclass in="dcgrwp(1,1,50,50)" out=isodc statsrc=none outstat=isodc maxnumit=5 printit=1 viewit=1 maxclust=10

    Clustering is performed on the input image DCGRWP. The resulting cluster assignment image is named ISODC. No input statistics are defined. The output statistics file is called ISODC. The maximum number of iterations is 5. The user wants to print summary statistics every iteration and to be given the chance to terminate after every iteration. The maximum number of clusters to be created is 10. Default values are used for the parameters CLUSDIST, MAXCLSTD, SSEPVAL, MINCLUST, CHNTHR, and PRINT.

  2. LAS> isoclass in="sanfran(1,1,100,100:1,2,3,4,5,7)" out=isosanf statsrc=file instat=isodc outstat=isosanf maxnumit=2 printit=2

    Clustering is performed on the image SANFRAN. The resulting cluster assignment image is named ISOSANF. The statistics file created in Example 1 is used as the starting point in the ISOCLASS clustering. The output statistics file is called ISOSANF. The maximum number of iterations is two. A statistics summary is printed after the second iteration.

Description/Algorithm:

   1.  ISOCLASS reads the initial cluster center from the statistics 
       file or assumes that all data are a single cluster 
       and computes the mean vector and standard deviations of 
       the data as the first seeding point.  The mean vector is 
       split.  (See the heading Splitting Clusters that follows.)
 
   2.  Data are assigned to clusters by the minimum distance rule.  
       The CITYBLOCK distance is used.
                                 
   3.  Cluster means and standard deviations are recomputed.  At 
       the last iteration, covariance matrices are computed.
 
   4.  At the PRINTITth iteration, a summary of cluster statistics 
       is printed. 
 
   5.  At the VIEWITth iteration, the user is asked if processing 
       should be interrupted.  If so, the next iteration is forced
       to be the last iteration.
 
   6.  If MAXNUMIT has been reached, the program goes to Step 11.
 
   7.  All clusters with fewer than MINCLUST members are deleted.
 
   8.  The type of iteration, either split or combine, is 
       determined.  (See the heading Determining Type of Iteration 
       that follows.)
 
   9.  Cluster centroids are split or combined.
 
  10.  The program returns to Step 2.
 
  11.  Statistics are computed and a summary is printed.  The 
       statistics are stored in OUTSTAT.
 
  12.  The image is chained.
 
The assignment of samples to clusters is done as follows.  The data 
point x =(x  ,x  ...x      ) is assigned to the Ith cluster if:
       k   k1  k2    kBANDS


            d(x ,m(I)) <= d(x ,m(J)) for all J != I, 
               k             k   

--where d(x ,m(I)) is defined as:
           k

                      BANDS  	              	          
                               |             |              	          
         d(x ,m(I)) =  SUM     |  x  - m (I) |
            k                  |   kj   j    |	          
                       j=1   	              	          

         --and m (I) is the mean for band j of the Ith cluster.
                j

Splitting Clusters:
__________________

A cluster is split along the jth coordinate (band) if (1) the jth
coordinate has the maximum standard deviation for the cluster, 
(2) the standard deviation along the jth coordinate is greater 
than the threshold MAXCLSTD, and (3) the cluster has more than 
2(MINCLUST+1) data.

If the previous conditions are met, two new clusters are created 
and the parent cluster is deleted.  A cluster is created merely 
by defining the center (mean) for each coordinate.  If the 
Ith cluster is split in the jth coordinate, the two new clusters 
will have centers at:

       (m (I),m (I),...,m (I) + a,...,m     (I)) ,   
         1     2         j           BANDS
--and

       (m (I),m (I),...,m (I) - a,...,m     (I)) ,   
         1     2         j           BANDS

--where a is:      
  normally, s (I) but can be a constant input by the user (SSEPVAL),  
             j

--and m (I) is the mean of the jth coordinate of the Ith cluster.
       j

On a given split iteration, all clusters that have a standard 
deviation greater than MAXCLSTD are split, provided the maximum 
number of clusters has not been reached.  In that event, 
reclassification of the data continues without the creation of 
new clusters. 

Deleting Clusters:
_________________

All clusters that have fewer than MINCLUST members are deleted.  A
cluster is deleted simply by removing the statistics for that 
cluster and reducing the number of clusters accordingly.

Combining Clusters:
__________________

Two clusters are combined if the distance between them is less than
the threshold parameter CLUSDIST.  The intercluster distance CLD
                                                               ij
between clusters I and J is calculated as:

                        ___                   ___
                       |        ___        ___   | 1/2
                       |       |           2  |  |
                       | BANDS | (m  - m  )   |  |
                       |       |   ki   kj    |  |         
              CLD   =  | SUM   | -----------  |  |
                 ij    |       |   a   a      |  |           
                       | k=1   |    ki  kj    |  |
                       |       |___        ___|  |
                       |___                   ___|

 --where a   is:     
          ki                    

   normally, s (I) but can be the constant input by the user (SSEPVAL). 
              k
       

If CLD   < CLUSDIST and CLD   < CLD   for all m != j and m > i, 
      ij                   ij      im       

--then the clusters I and J are merged to form a new cluster, L, 
  with means: 

                 N(I)m (I) + N(J)m (J)    
                      k           k    
         m (L) = ---------------------,   k=1,...,BANDS
          k                                   
                     N(I) + N(J)

 --where N(I) is the total number of data points assigned to 
   cluster I.  The clusters I and J are deleted.  The new 
   cluster, L, is not considered a candidate for merging with 
   any other cluster on the iteration in which it was found.  


Determining Type of Iteration:
_____________________________

The iteration may be a split iteration or a combine iteration.  The
sequence of iterations is as follows:

      SSSSCSCSC...S             

     --where:
                                
      S = split iteration
      C = combine iteration
                                
The beginning sequence of split iterations is terminated when at
least 80 percent of the clusters have standard deviations less 
than the threshold parameter MAXCLSTD.  At that point, the 
iterations alternate between combine and split until the last iteration, 
which is always a split iteration.

The initial split iterations are for the automatic initialization 
of cluster centers in the event they are not input.  The sequence 
is shortened considerably if initial cluster centers are input.


Chaining Clusters:
_________________

The last step in the clustering procedure groups all clusters that
have intercluster distances less than CHNTHR, forming one cluster. 
The chaining procedure is adopted because the minimum variance 
criteria used in the iterative procedure tends to group the data into
spherical (or ellipsoidal) groupings with Gaussian distributions. 
This type of grouping is certainly a natural grouping and would 
quite often be completely satisfactory.  However, there could be 
natural groupings of the data that are oddly shaped and cannot be
approximated by Gaussian distributions.  Two examples are given in
Figure 1.  At the end of the sequence of split and combine 
iterations, groupings of the type in Figure 1 are likely to be separated 
into clusters as illustrated in Figure 2.  The chaining algorithm 
groups the clusters 1, 2, and 3 (Figure 2) into one composite 
cluster; likewise, clusters 4, 5, 6, and 7 are grouped together to 
form one cluster.

The intercluster distances are computed and chaining begins with 
the first appearance of two clusters within a distance of CHNTHR 
units.  Once a cluster is in the chain, all clusters within CHNTHR 
units of that cluster are added to the chain.  (See example in 
Figure 3.)

The statistics (means, standard deviations, and covariance matrices)
of the clusters resulting from chaining are not calculated by the
Gaussian distribution.  The cluster assignment image also does not
reflect chaining.

There are, of course, instances in which clusters that are chained
by the program can be safely combined into one composite (Gaussian)
cluster.  For example, the three clusters 1, 2, and 3 in Figure 4
can safely be combined into one final cluster.  An indication of 
such formulas can be used iteratively to compute the composite 
statistics.

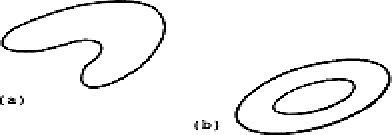
     Figure 1.  (a) The boomerang-shaped cluster
                (b) The donut-shaped cluster 

     Figure 2.  Breaking up of the clusters (a) and (b) of 
                Figure 1 into subclusters

(a)

(b)
          \\ I |
         J \\  |   1   |   2   |   3   |   4   |   5 
    __________|_______|_______|_______|_______|_______
         1    |  0.0  |  7.5  |  6.2  |  3.2  |  11.8
         2    |  7.5  |  0.0  |  3.1  |  5.6  |   3.0
         3    |  6.2  |  3.1  |  0.0  |  3.1  |   6.2   DLMIN=3.2
         4    |  3.2  |  5.6  |  3.1  |  0.0  |   9.7
         5    | 11.8  |  3.0  |  6.3  |  9.7  |   0.0

     Figure 3.  Example of Chaining: 
               (a) Cluster structure
               (b) Intercluster distance table

     Figure 4.  An example in which the chained subclusters can 
                safely be combined into one composite cluster.
Assuming that two clusters {n1,m1,C1} and {n2,m2,C2} are considered as one cluster {n,m,C}, where n's, m's, and C's are, respectively, the number of points, mean vectors, and covariance matrices, then:

             n = n  + n 
                  1    2      


                   n              n
                    1              2
             m = ------- m   +  ------- m
                 n  + n    1    n  + n    2
                  1    2         1    2


                   n             n
                    1             2 
             C = ------- C  +  ------- C  
                 n  + n   1    n  + n   2
                  1    2        1    2
                
                      n               n
                       1       T       2       T       T 
                 +  ------- m m  +  ------- m m   -  mm 
                    n  + n   1 1    n  + n   2 2   
                     1    2          1    2
The user should be cautious about the values of CLUSDIST and MAXCLSTD in the combine and split routines. The range of values 3.2-3.9 for CLUSDIST have been established in connection with the probability of misclassification. Values outside this range are discouraged. Of course, values of CLUSDIST closer to the lower bound will induce finer groupings, while larger values will induce coarser groupings.

As to the value of MAXCLSTD, its value directly governs the size of nominal-sized clusters. For data collected by multispectral scanners, a MAXCLSTD value of 4.5 is suggested. Higher values of this threshold are acceptable, e.g., 6.0 and 7.0, inducing coarser groupings.

The statistics of each cluster are written to the statistics file named in OUTSTAT. OUTSTAT is a new file every time. ISOCLASS names the classes as CLUSTO1, CLUSTO2, etc. The user may start ISOCLASS again using the statistics file from the previous ISOCLASS execution as input and can continue the iterations from there.

Nonfatal Error Messages:

  1. [isoclass-keybd] Error reading keyboard response

    Enter correct response.

  2. [isoclass-write] Error writing to output history file

    Check history file--it is probably incorrect.

Fatal Error Messages:

  1. [isoclass-alloc] Error allocating dynamic memory

    An error was encountered allocating dynamic memory. Contact system manager.

  2. [isoclass-close] Error closing <xxxx> <xxxx> file

    An error was encountered closing the specified file. Check file for completeness.

  3. [isoclass-fatal] Fatal error encountered

    A fatal error was encountered during processing. The output file is deleted if $DELFLG="YES" and processing is terminated. The messages displayed immediately preceding this message specify the specific error encountered.

  4. [isoclass-open] Error opening <xxxx> <xxxx> file

    An error was encountered opening the specified file. Check to be sure that it exists and that you have access to read it.

  5. [isoclass-read] Error reading <xxxx> from <xxxx> <xxxx> file

    An error was encountered reading the specified file. Verify the format of the file.

  6. [isoclass-write] Error writing <xxxx> to <xxxx> <xxxx> file

    An error was encountered writing to the specified file. Verify access privileges.

  7. [isoclass-bands] Error: Incorrect number of bands in input mean vectors

    The dimension of the mean vector in the input statistics file is not the same as the number of bands specified by IN. The user should examine the statistics file and possibly change the number of bands specified by IN or change the statistics file using the COPY command of EDITSTAT.

  8. [isoclass-size] Error: Images must be same size

    If more than one image is specified as input, they must be the same size. Check to be sure they are.

  9. [isoclass-nocls] Error: Input statistics file contains no classes

    Regenerate input statistics file containing appropriate classes.

  10. [isoclass-split] Error: Unable to split initial cluster, maxclstd and/or minclust too large

    The initial single cluster cannot be split. Specify smaller values for MAXCLSTD and MINCLUST and rerun the program.

User Notes:

  1. ISOCLASS may be started at the point it was terminated by inputting the statistics file written by the previous run of ISOCLASS.

  2. The validity of the output from ISOCLASS is greatly affected by the choice of initial parameters and their interaction with each other. For instance, if the maximum number of clusters is set artifically low, the resulting clusters will be more the result of the order in which the program splits clusters than the intrinsic structure of the data. This same phenomenon can occur with numerous other combinations of inputs--so choose your parameters wisely.